Good news for non-profits: there’s a ton of information and data out there to help you understand your community and the people who live in it. Bad news for non-profits: there’s a ton of information and data out there. It can be hard to find what you’re looking for across multiple sites and agencies, especially if you aren’t certain who hosts which indicators. Even if you know where to look, it often takes a lot of time to gather that information and convert it into a useful format.
Given these challenges, I was happy to learn about Community View, a catalogue of data for Saskatoon and area. Developed by Saskatoon Health Region and supported by several local partners including the University of Saskatchewan, it’s an online tool that provides free access to a host of community-level indicators.
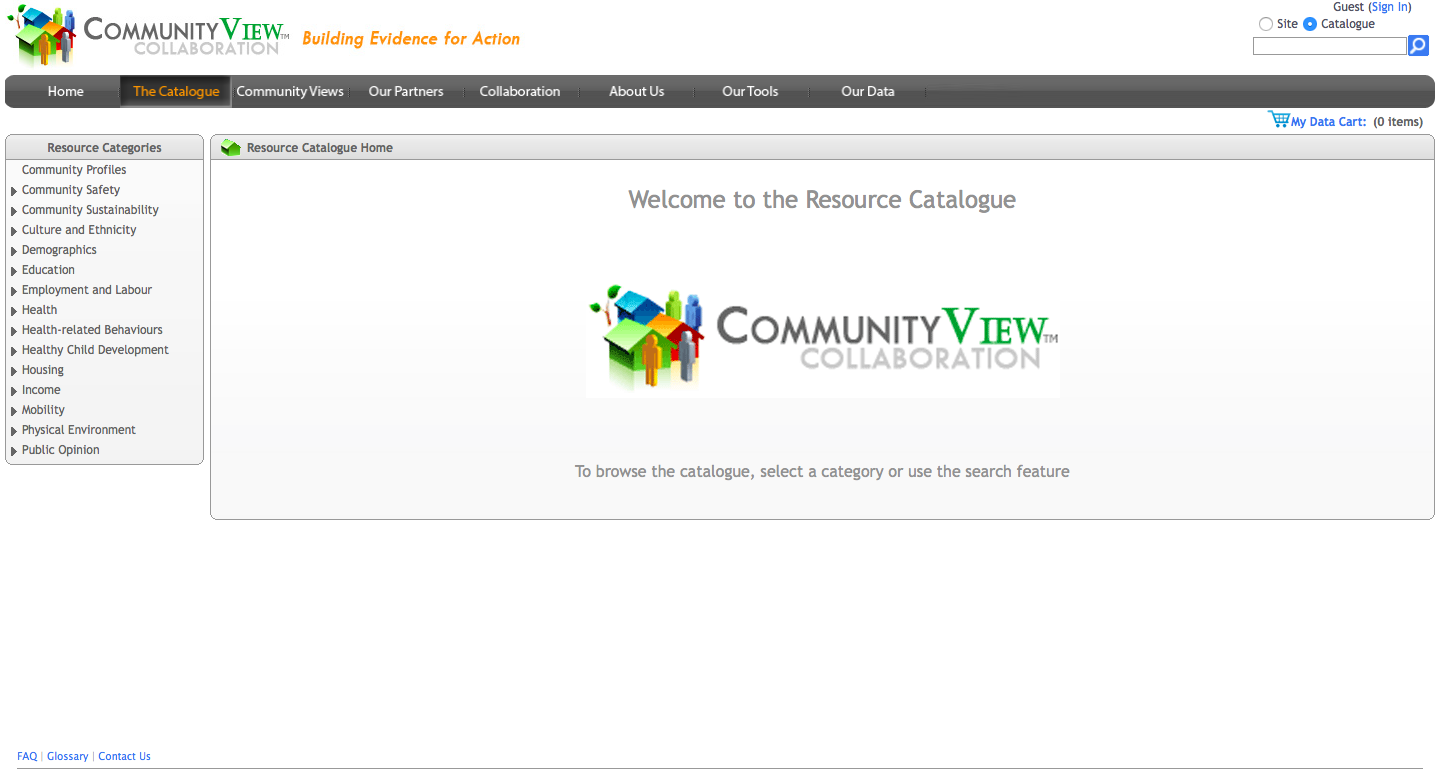
Last week I attended a workshop on using the tool, and a couple things stood out for me:
- There’s a great range of reliable data sources – mostly census1 but also other sources such as from the Health Region and the school boards
- The “data cart” feature sounds like an odd idea at first, but once you start using it to select indicators, it makes perfect sense.
- Data can be easily filtered, including down to the neighbourhood level in Saskatoon for most stats. Filters can be applied to individual data sources or to the whole cart of indicators2.
- Mapping tools are included, with options to show data (again on the neighbourhood level for most indicators) as either colour gradients or sized circles.
- Data can be viewed in tabular form in the web browser as well as exported to Excel.
- For the stats nerds among us, there are advanced features to play around with including setting different cutoffs for colour gradients on the map, creating new variables based on mathematical expressions (such as percentages), and uploading your own geocoded data to be mapped.
- To bolster the amount of information available, documents such as written reports and articles are also included. Fortunately, it is easy to filter these documents out from listings and search results if you’re just looking for data sets.
Overall, Community View is a great resource for Saskatoon-based community researchers. For someone new to the world of community-level data and the online platforms that house them, it may be a bit intimidating at first: efforts such as the workshop I attended were clearly designed to alleviate the learning curve. Otherwise, I just wish that I had known about this tool sooner, and as one of the workshop attendees commented, that it was available for data across Canada!
What do you think about this tool? Are there similar websites out there that similarly bring together multiple datasets for community researchers? Share in the comments below, through Twitter, or the usual contact means.
- Including the infamous National Household Survey ↩︎
- Notwithstanding some peculiarities when mixing and matching different data sources ↩︎